

In Difficult Times Good People gravitate towards Absolute Truth


A Complicated Debate: Have States Been Disinvesting in Higher Education?


Publisher's note: The James G. Martin Center for Academic Renewal is a nonprofit institute dedicated to improving higher education in North Carolina and the nation. Located in Raleigh, North Carolina, it has been an independent 501(c)(3) organization since 2003. It was known as the John W. Pope Center for Higher Education Policy until early January 2017.
The author of this post is Andrew Gillen.
"Two days. Two reports citing the same data. Two different conclusions." That is how Rick Seltzer described the near-simultaneous release of two studies looking at state funding in Inside Higher Ed.
The first study was written by myself for the Texas Public Policy Foundation and found that state disinvestment is a myth. The second study, by Michael Mitchell, Michael Leachman, and Matt Saenz for the Center on Budget and Policy Priorities, found that on average, the states have been disinvesting in higher education.
Both studies relied on the same data set (SHEF), put out by the State Higher Education Executive Officers Association. Adding to the confusion was that SHEEO was able to replicate my figures, but disagreed with my conclusions-while being unable to replicate CBPP's numbers, but agreeing with their conclusions based on their own analysis.
So to sum up, three sets of analysts looked at the same data and had three different interpretations.
What's going on?
The most obvious difference between the three analyses is different time frames. The chart below recreates each group's original figures, which covers 38 years of data (TPPF), 25 years (SHEEO), and 10 years (CBPP).
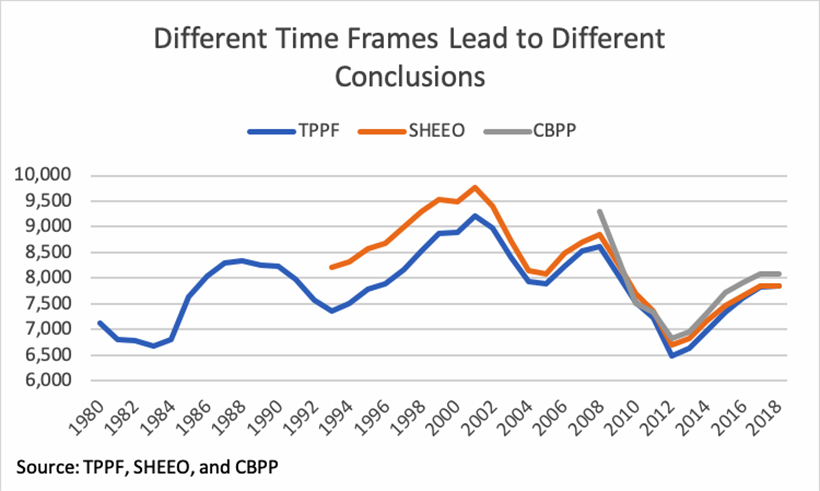

Conclusions based on more data are generally more reliable. CBPP concluded there was state disinvestment because from 2008 to 2018, states cut funding by $1,220 per student, which, under its methodology is true. Also true, using that same methodology, is that from 2012 to 2018 state funding increased by $1,126 per student, and that from 1980 to 2018, state funding increased by $4 per student.
Are we to conclude from this that state disinvestment isn't happening at all (the $4 increase from 1980 to 2018) or even that we are currently in a trend of state reinvestment (the $1,126 increase since 2012)?
The problem is that any arbitrary (and/or cherry-picked) start and end date can lead to unreliable conclusions.
For example, suppose there is no change in state funding for the next two years. A future CBPP report with a 10-year time frame, looking at 2010-2020, will conclude that there is no state disinvestment, since funding would have increased by over $500 per student. Yet in this scenario, per-student funding would still be $1,220 below the 2008 level. This puts CBPP in a tough spot. If they stick with the 2010-2020 analysis, then they present an incomplete picture of recent changes in state funding, but if they change their dates to 2008-2020, it will appear that they are cherry-picking the start date to reach a predetermined conclusion.
My TPPF report argues that this problem can be avoided in two ways. First, rather than look at just a portion of the data, include all the available data. Second, rather than draw sweeping conclusions based off beginning and endpoint comparisons, use a regression to determine if there is a trend, since the regression results are less dependent on the choice of (possibly unrepresentative) starting and ending dates.
And note that I practice what I preach. Under my methodology, state funding per student increased by over $700 per student from 1980 to 2018, yet I didn't conclude that there was an upward trend in state funding over time because the regression results indicated that 1980 was an uncharacteristically low funding year (see figure 1 in my report and note that the regression line in 1980 is substantially above the actual 1980 value).
If you extend all three methods for the full 38 years, as shown in the next chart, it is clear that they are largely telling the same story. In particular, the decline since 2008 is evident in all three sets of figures. But it is also apparent that this decline was just the most recent iteration of a historical pattern we've seen for the last 38 years-namely, substantial funding cuts when the economy enters a recession followed by slow increases as the economy recovers.
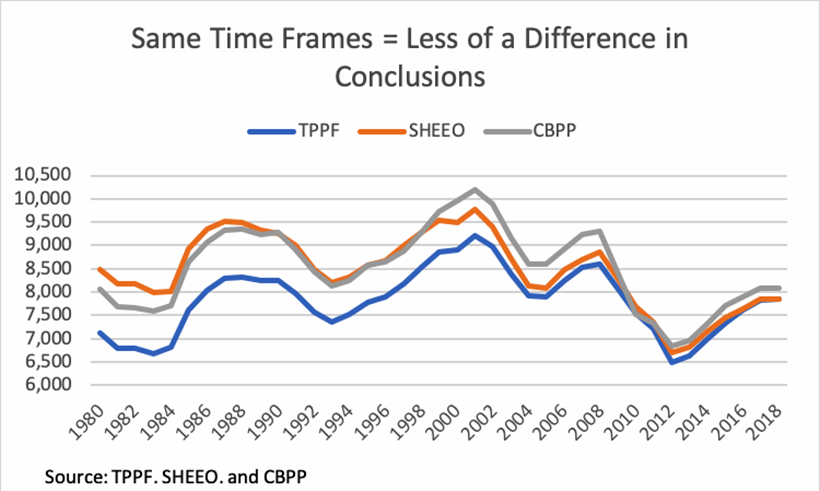

Yet even after extending all three sets of numbers to cover all 38 years, there are still some differences. For example, from 1980 to 2018, the TPPF numbers show an increase of $700 in state funding per student, the CBPP numbers show an increase of $4, and the SHEEO numbers show a decline of $600. There are two reasons for these differences.
First, each report used a different price index to adjust for inflation. SHEEO uses the HECA, TPPF used the CPI-U, and CBPP used the CPI-U-RS. The CPI-U and the CPI-U-RS are very similar and are widely acknowledged to be legitimate methods of correcting for inflation (CBPP's choice is the best because the CPI-U-RS is more consistent across time). The HECA however, is not an inflation adjustment, it is a cost adjustment (HECA is short for the Higher Education Cost Adjustment). Because costs have increased over time, adjusting by the HECA will overstate past funding levels (if you'd like to read more about this, see HERE for a longer piece or HERE for a short version).
The bottom line is that TPPF and CBPP are on solid ground regarding inflation adjustments, but the SHEEO numbers should not be mistaken for representing inflation-adjusted state funding over time. Thus, while the SHEEO figures show a trend of disinvestment, this is entirely due to adjusting for costs, not inflation.
The second difference is what's counted as state funding. Both SHEEO and TPPF use "Educational Appropriations" whereas CBPP uses "State Support for All Higher Education." (Like SHEEO, I had trouble replicating CBPP's findings until the CBPP analysts graciously walked me through their analysis and we discovered the different variable choices). "Educational Appropriations" tries to determine the amount of funding available for educational purposes, which adds local funding but excludes spending for research, agricultural programs, and medical schools. "State Support for All Higher Education" tracks total state support regardless of purpose, so it includes spending for research, agricultural programs, and medical schools and does not include local funding.
Unlike the previous two differences, which had choices that were superior ("more data is better" and "adjust for inflation rather than costs"), this difference isn't as clear.
The SHEEO and TPPF figures do a better job of looking at educational spending, but they include local funding, which muddies the waters a bit if the question is what's happening to state funding. CBPP gets a better picture of overall state funding, but it mingles research, agricultural, and medical school (RAM) funding in with educational funding before calculating a per-student amount. But it's not clear why these RAM categories should be calculated on a per-student basis. Shouldn't medical school funding be determined by the medical training needs of a state's residents, rather than enrollment at community colleges? And what if, over time, RAM funding shifted to private colleges or laboratories? Should that really count as a decline in state funding for higher education?
To sum up, SHEEO does a great job of gathering and tabulating the data, and is a model of transparency by making their data available to all. But SHEEO adjusts for costs rather than inflation, rendering their figures the least reliable.
CBPP uses the best inflation adjustment and looks at just state funding (the focus of the state disinvestment debate). But they only look at 10 years of data, leading them to, in my opinion, miscategorize a typical cyclical drop in funding for a trend of state disinvestment. CBPP's per-student figures also include state funding for research and medical schools when it's not clear why those should be tracked on a per-student basis, and these amounts could be distorted if that funding is increasingly going to private universities or laboratories.
Finally, the TPPF figures focus on educational revenue and use a reasonable adjustment for inflation, but include local funding, which makes the figures less useful as a metric of state funding.
Where does this leave the state disinvestment debate?
The only support I can see for the idea that states are disinvesting in higher education relies on either an arbitrarily limited portion of the available data (CBPP) or doesn't correct for inflation (SHEEO). If you look at all of the available data and use a legitimate price index to adjust for inflation, as the TPPF report does, then the conclusion is clear-states have not been disinvesting in higher education.
Andrew Gillen is a senior policy analyst in the Texas Public Policy Foundation's Center for Innovation in Education and an adjunct professor of economics at Johns Hopkins University.
Go Back
The author of this post is Andrew Gillen.
"Two days. Two reports citing the same data. Two different conclusions." That is how Rick Seltzer described the near-simultaneous release of two studies looking at state funding in Inside Higher Ed.
The first study was written by myself for the Texas Public Policy Foundation and found that state disinvestment is a myth. The second study, by Michael Mitchell, Michael Leachman, and Matt Saenz for the Center on Budget and Policy Priorities, found that on average, the states have been disinvesting in higher education.
Both studies relied on the same data set (SHEF), put out by the State Higher Education Executive Officers Association. Adding to the confusion was that SHEEO was able to replicate my figures, but disagreed with my conclusions-while being unable to replicate CBPP's numbers, but agreeing with their conclusions based on their own analysis.
So to sum up, three sets of analysts looked at the same data and had three different interpretations.
What's going on?
The most obvious difference between the three analyses is different time frames. The chart below recreates each group's original figures, which covers 38 years of data (TPPF), 25 years (SHEEO), and 10 years (CBPP).

Conclusions based on more data are generally more reliable. CBPP concluded there was state disinvestment because from 2008 to 2018, states cut funding by $1,220 per student, which, under its methodology is true. Also true, using that same methodology, is that from 2012 to 2018 state funding increased by $1,126 per student, and that from 1980 to 2018, state funding increased by $4 per student.
Are we to conclude from this that state disinvestment isn't happening at all (the $4 increase from 1980 to 2018) or even that we are currently in a trend of state reinvestment (the $1,126 increase since 2012)?
The problem is that any arbitrary (and/or cherry-picked) start and end date can lead to unreliable conclusions.
For example, suppose there is no change in state funding for the next two years. A future CBPP report with a 10-year time frame, looking at 2010-2020, will conclude that there is no state disinvestment, since funding would have increased by over $500 per student. Yet in this scenario, per-student funding would still be $1,220 below the 2008 level. This puts CBPP in a tough spot. If they stick with the 2010-2020 analysis, then they present an incomplete picture of recent changes in state funding, but if they change their dates to 2008-2020, it will appear that they are cherry-picking the start date to reach a predetermined conclusion.
My TPPF report argues that this problem can be avoided in two ways. First, rather than look at just a portion of the data, include all the available data. Second, rather than draw sweeping conclusions based off beginning and endpoint comparisons, use a regression to determine if there is a trend, since the regression results are less dependent on the choice of (possibly unrepresentative) starting and ending dates.
And note that I practice what I preach. Under my methodology, state funding per student increased by over $700 per student from 1980 to 2018, yet I didn't conclude that there was an upward trend in state funding over time because the regression results indicated that 1980 was an uncharacteristically low funding year (see figure 1 in my report and note that the regression line in 1980 is substantially above the actual 1980 value).
If you extend all three methods for the full 38 years, as shown in the next chart, it is clear that they are largely telling the same story. In particular, the decline since 2008 is evident in all three sets of figures. But it is also apparent that this decline was just the most recent iteration of a historical pattern we've seen for the last 38 years-namely, substantial funding cuts when the economy enters a recession followed by slow increases as the economy recovers.

Yet even after extending all three sets of numbers to cover all 38 years, there are still some differences. For example, from 1980 to 2018, the TPPF numbers show an increase of $700 in state funding per student, the CBPP numbers show an increase of $4, and the SHEEO numbers show a decline of $600. There are two reasons for these differences.
First, each report used a different price index to adjust for inflation. SHEEO uses the HECA, TPPF used the CPI-U, and CBPP used the CPI-U-RS. The CPI-U and the CPI-U-RS are very similar and are widely acknowledged to be legitimate methods of correcting for inflation (CBPP's choice is the best because the CPI-U-RS is more consistent across time). The HECA however, is not an inflation adjustment, it is a cost adjustment (HECA is short for the Higher Education Cost Adjustment). Because costs have increased over time, adjusting by the HECA will overstate past funding levels (if you'd like to read more about this, see HERE for a longer piece or HERE for a short version).
The bottom line is that TPPF and CBPP are on solid ground regarding inflation adjustments, but the SHEEO numbers should not be mistaken for representing inflation-adjusted state funding over time. Thus, while the SHEEO figures show a trend of disinvestment, this is entirely due to adjusting for costs, not inflation.
The second difference is what's counted as state funding. Both SHEEO and TPPF use "Educational Appropriations" whereas CBPP uses "State Support for All Higher Education." (Like SHEEO, I had trouble replicating CBPP's findings until the CBPP analysts graciously walked me through their analysis and we discovered the different variable choices). "Educational Appropriations" tries to determine the amount of funding available for educational purposes, which adds local funding but excludes spending for research, agricultural programs, and medical schools. "State Support for All Higher Education" tracks total state support regardless of purpose, so it includes spending for research, agricultural programs, and medical schools and does not include local funding.
Unlike the previous two differences, which had choices that were superior ("more data is better" and "adjust for inflation rather than costs"), this difference isn't as clear.
The SHEEO and TPPF figures do a better job of looking at educational spending, but they include local funding, which muddies the waters a bit if the question is what's happening to state funding. CBPP gets a better picture of overall state funding, but it mingles research, agricultural, and medical school (RAM) funding in with educational funding before calculating a per-student amount. But it's not clear why these RAM categories should be calculated on a per-student basis. Shouldn't medical school funding be determined by the medical training needs of a state's residents, rather than enrollment at community colleges? And what if, over time, RAM funding shifted to private colleges or laboratories? Should that really count as a decline in state funding for higher education?
To sum up, SHEEO does a great job of gathering and tabulating the data, and is a model of transparency by making their data available to all. But SHEEO adjusts for costs rather than inflation, rendering their figures the least reliable.
CBPP uses the best inflation adjustment and looks at just state funding (the focus of the state disinvestment debate). But they only look at 10 years of data, leading them to, in my opinion, miscategorize a typical cyclical drop in funding for a trend of state disinvestment. CBPP's per-student figures also include state funding for research and medical schools when it's not clear why those should be tracked on a per-student basis, and these amounts could be distorted if that funding is increasingly going to private universities or laboratories.
Finally, the TPPF figures focus on educational revenue and use a reasonable adjustment for inflation, but include local funding, which makes the figures less useful as a metric of state funding.
Where does this leave the state disinvestment debate?
The only support I can see for the idea that states are disinvesting in higher education relies on either an arbitrarily limited portion of the available data (CBPP) or doesn't correct for inflation (SHEEO). If you look at all of the available data and use a legitimate price index to adjust for inflation, as the TPPF report does, then the conclusion is clear-states have not been disinvesting in higher education.
Andrew Gillen is a senior policy analyst in the Texas Public Policy Foundation's Center for Innovation in Education and an adjunct professor of economics at Johns Hopkins University.

| States Like Georgia Lead the Way in Health Care Reform | James G. Martin Center for Academic Renewal, Editorials, Op-Ed & Politics | School Choice Highlights Split Between Minorities and Democratic Party |


Home
Contact
About
Service Rates
Privacy Policy
Follow on Facebook
Subscribe to Newsletters
Rss Feed
Keywords
Eastern NC Now & ENC NOW © Copyright 1998-2024 All Rights Reserved.
